Professional quantitative investing.
Powered by AI.
QuantForge gives retail investors the same analytical depth institutions use — real market data, real portfolio risk analytics, and real backtesting. Not a mockup. Not a signal service. A research terminal you actually run your own numbers on.
QuantForge is a research and analytics tool — not a financial advisor, broker, or signal service.
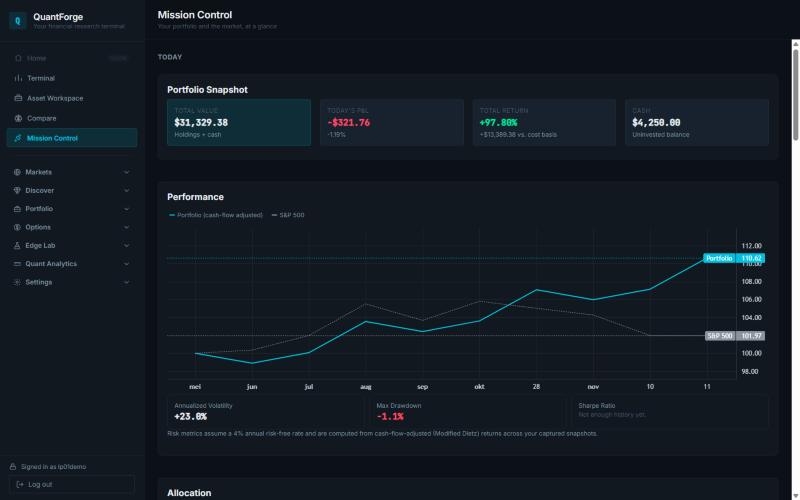
Everything you need to research, test, and track
Three real screens from the actual product — not mockups.
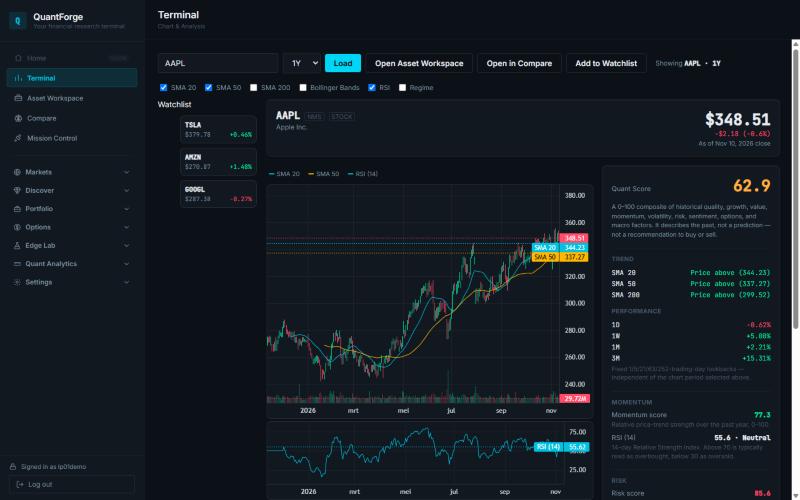
Terminal — chart & analysis
A real-time technical research terminal with the indicators serious investors actually use, plus a transparent Quant Score that shows exactly which factors drove it.
- ✓SMA 20/50/200, Bollinger Bands, RSI, regime detection
- ✓Quant Score — a 0–100 composite of quality, growth, value, momentum, volatility, risk, sentiment, and macro factors
- ✓Full explainability — never a black-box number
Mission Control — your portfolio, at a glance
One dashboard for your whole portfolio: real-time value and P&L, time-weighted performance against the S&P 500, risk metrics, a materiality-filtered "what changed since you last visited," and a prioritized risk radar — not fifteen tabs you have to dig through.
- ✓Time-weighted performance vs. S&P 500 benchmark
- ✓Volatility, max drawdown, and Sharpe ratio
- ✓Risk Radar — concentration, volatility, and drawdown alerts, prioritized
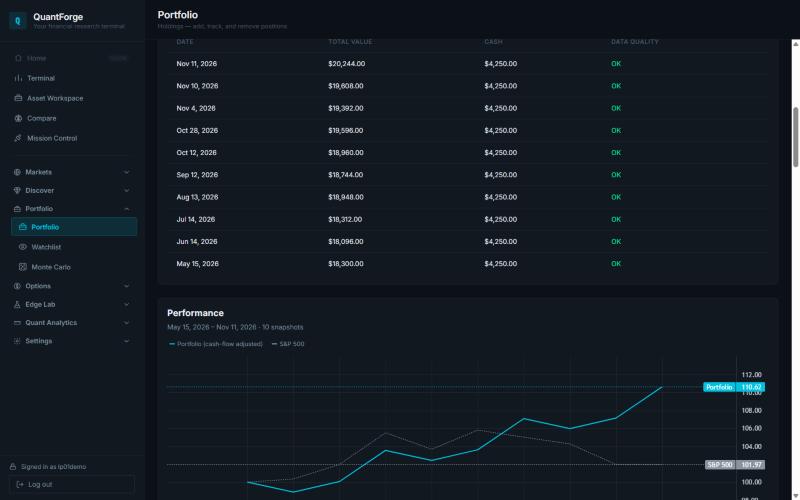
Portfolio — track every position, honestly
Add real holdings and cash, capture dated snapshots over time, and see your actual total return against cost basis — with every number traceable back to a real calculation, never a fabricated placeholder.
- ✓Holdings, cash, and total return tracking
- ✓Dated portfolio snapshot history
- ✓Backtesting and Monte Carlo simulation on your own numbers
From sign-up to insight in minutes
Create a free account
No credit card required. Add your holdings and cash, or explore with the Watchlist first.
Analyze with real data
Run the Terminal, Mission Control, Backtesting, and Monte Carlo on real market data and your own numbers.
Track what matters
Capture snapshots over time and see your real performance and risk — not a one-time estimate.
Free vs. Pro
Start free. Upgrade when you need more room to analyze, test, and explore.
Free
For getting started
forever
- ✓Watchlist — up to 10 tickers
- ✓Hidden Gems — top 10 results
- ✓Monte Carlo — up to 100 paths
- ✓Backtesting — 1 year of history
Pro
For serious investors
or €149/year
- ✓Everything in Free
- ✓Unlimited Watchlist tickers
- ✓Unlimited Hidden Gems results
- ✓Unlimited Monte Carlo simulation paths
- ✓Unlimited backtesting history
- ✓Hidden Gems CSV export
Pro+
For advanced research
or €299/year
- ✓Everything in Pro
- ✓Early access to new capabilities as they ship
Prices shown in EUR, billed monthly or annually. See the full plan comparison after signing in.
See your portfolio the way institutions see theirs.
Free to start. Real data from day one.
Get started free